Quick Start Guide to the Beer CMA - Part 2
Focusing on two unique dashboards: Footprint, a top-level bar chart showing basic measures for all geographies in your subscription, and Item Audit, which breaks out SKUs by their Circana coding values.
The Footprint Dashboard
- Footprint is a unique dashboard because it shows brand family performance and development data across geographies.
- When first landing on this dashboard you’ll see four columns of bars. From left to right, these bars show Dollar Sales, Dollar Sales CHG YA, Trend percentage, and CWD percentage for your brand family across your CMA’s entire set of geographies.
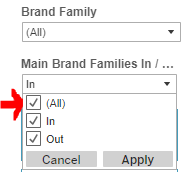
- In the upper right corner of the dashboard, if you open the BRAND FAMILY filter, you’ll see that it only lists your brand family(s). The list can be expanded to show all brand families which have generated sales in these geographies by using the MAIN BRAND FAMILIES IN/OUT filter (directly below the BRAND FAMILY filter). In the MAIN BRAND FAMILIES IN/OUT filter, check the box for “ALL”, and click “Apply”.

- After doing so, the BRAND FAMILY filter should include a large list of brand families to choose from, and you can select any one of them to see how they’re faring in each geography. This is an easy way to keep tabs on competitors or benchmark suppliers, to see which markets they’re doing well in, and which ones not so much. You could also then narrow down the PACKAGE TYPE filter to “CAN” and narrow the PACKAGE SIZE GROUP filter down to “12pk 11-13oz”, to see where a competitor/benchmark brand is having success (or not) with 12pks of cans.
- To take this a step further, keeping the MAIN BRAND FAMILIES IN/OUT filter set to “ALL”, now check the “ALL” box in the BRAND FAMILY filter. This way, the bar chart will reflect Dollar Sales, Dollar Sales CHG YA, etc., for all brand families combined in each geography. Then, you can use the package and/or style filters to narrow down to a single package group and/or style and see how a particular type of product is doing as a whole across your geographies. Manipulating the style or package filters with all brand families included can call attention to overarching trends, while looking at each market side-by-side.
- The 3rd column of bars on the chart shows Dollar Trend vs Last Year by default, but you’ll see that this column of bars has been named “Ranker 3rd Column Value”. You can use the RANKER 3RD COLUMN parameter to choose different values to display here, such as “Dollar Sales per Point of CWD”, if you’d like.
The Item Audit Dashboard
- Item Audit is another unique dashboard which shows us how any UPC in the database has been coded by Circana. This can be essential when filtering by style values to compare similar brands/items. Like the Footprint dashboard, Item Audit offers only one level of brand: the "brand family" level. By default, the Item Audit's BRAND FAMILY filter will be filtered to only your brand family, but any brand family can be selected in the filter.
- PLEASE NOTE: The BRAND FAMILY filters in the Footprint and Item Audit dashboards are linked and listen to each other - both are set by default to show only your brand family. This is different from the default BRAND FAMILY filter setting on the other dashboards, which are set to include ALL brand families by default. For this reason, the BRAND FAMILY filters on the Footprint and Item Audit dashboards are also disconnected from the BRAND FAMILY filters on the rest of the CMA's dashboards.
- Item Audit can show you which of your items have been coded by Circana, and if those which are coded are still coded correctly. It can also be useful when running searches for brands by style (comparing brands which share similar styles) because Item Audit will show you how Circana has coded the Beer Style and Micro Style values for your UPCs. Read more about queries by style here.
