The Discovery Dashboards
These essential dashboards show us trends, growth, and declines, offering insights into which segments, styles, and package types are accelerating, and which aren’t. They offer a high-level view to uncover various opportunities and turn those opportunities into stories, which can translate as assortment solutions and drive pricing and promotion decisions.
Category/Segment Analysis:
- On this dashboard, data is broken out for each Segment in the beer category within a single geography. To switch geographies, use the GEOGRAPHY filter in the top right corner of the view.
- For any selected geography, the tree map shows the share of the dollar sales for each segment.
- The bar chart in the lower left corner shows Dollar Sales for each segment.
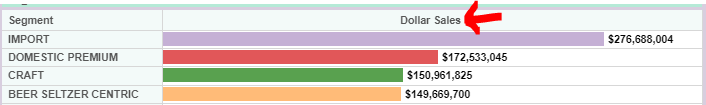
- The bar chart can display different measures by adjusting the SALES MEASURE SELECTION parameter (the other charts on the dashboard will not be affected). For example, by switching the SALES MEASURE SELECTION parameter from “Dollar Sales” to “Dollar Sales Chg YA”, the bar chart will provide a look at which segments are adding incremental dollars to the beer category, and which ones have seen a decline in sales compared to the same span of weeks a year ago.

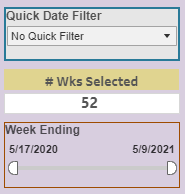
- To change the timeframe of selected weeks, use the QUICK DATE FILTER to choose one of 5 standard timeframes. For a more custom timeframe, the “Week Ending” filter (under the Wks Selected display) can be used. When using the Week Ending filter, we recommend clicking on the start date and the end date and selecting your dates from the popup calendars, rather than using the slider.
Style Analysis:
- Note that by changing the SALES MEASURE SELECTION parameter on the Category/Segment Analysis dashboard to Dollar Sales CHG YA, the selection carried through to the bar chart on this Style Analysis dashboard.
- The tree map on the Style Analysis dashboard displays share percentages for each style in the selected geography.
- You'll see 3 different style-related dashboard controls. F or the most part, the BEER STYLE LEVELS parameter and the BEER STYLE LEVEL VALUE filter are the only style-related dashboard controls you'll ever need in the CMA workbook.
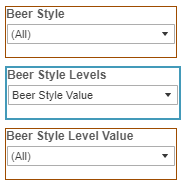
- For example, by switching the BEER STYLE LEVELS parameter to "Micro Style", this dashboard’s tree map and bar chart will refresh and display Micro Styles instead of Beer Styles. In contrast to the "Beer Style" breakout of styles, “Micro Style” is a more granular level of style. Micro Styles are sub-styles of the Beer Styles, so Micro Style breaks IPAs out into “American IPA”, “Session IPA” “Imperial IPA”, etc.
- The BEER STYLE LEVELS parameter and the BEER STYLE LEVEL VALUE filter are intertwined. You can use the parameter to choose which level of style you’d like to explore, and doing so will change the list displayed in the BEER STYLE LEVEL VALUE filter (go ahead and give it a try). Since the CMA’s BEER STYLE LEVELS parameter is set to “Beer Style” by default, the list in the BEER STYLE LEVEL VALUE filter will display the Beer Style breakout of styles unless you switch it to a different level of style. By switching the BEER STYLE LEVELS parameter to “Micro Style”, the list in BEER STYLE LEVEL VALUE filter will change to display the more granular Micro Style breakout of styles. On dashboards like the Rankers, which compare brands and SKUs, you can then select a single Micro Style (e.g., "Imperial IPAs") in the BEER STYLE LEVEL VALUE filter, filtering out all brands which aren't Imperial IPAs from the Ranker's bar chart.
Package Analysis
- Package Analysis displays share and performance data for various package sizes/types and shows what’s gaining momentum or lagging. Note that the Circana classifications of PACKAGE SIZE GROUP are each capturing a small range (e.g., your classic 6pk of 12oz cans or bottles falls into the 5-6pk 11-13oz category).
In these Discovery dashboards, try switching between geographies and using different timeframes. If the growing momentum or decline of a segment/style/package catches your attention, you can jump to a Ranker dashboard to see exactly which brands are contributing to those trends. If you begin to wonder, for instance, which brands are driving the upward trajectory for a particular style, you could use a Ranker to dig deeper (using BEER STYLE LEVELS parameter and the BEER STYLE LEVEL VALUE filter) and see which brands are contributing to the growth of that style.