What's the Best Way to Download a Column & Row Chart from a Dashboard?
Not all charts translate well to crosstab, but the CMA's Column & Row (C&R) dashboards can be downloaded as CSV or Excel files using these instructions.
To download a Column & Row chart, select "Download" from the menu bar at the top of the screen:

Then, choose “Crosstab” from the pop-up window:

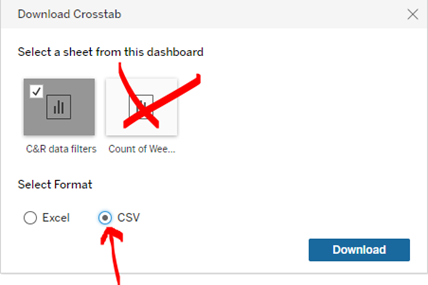
Then, in the popup box, select the specific chart that you wish to capture (such as “C&R Data Filters”, shown in the example below). Charts are referred to as "sheets" in Tableau. Make sure the “Count of Weeks” sheet option (crossed out in the image below) is unchecked, as it will not be useful.
We recommend selecting CSV as the desired format, which increases downloading speed and preserves the formatting of the charts most accurately. Once you've downloaded to CSV, you can "Save As" and convert the file to Excel if desired. Click the blue "Download” button, and then locate the CSV file in your computer’s “Downloads” folder.

Visual charts like tree maps and bar charts do not translate well to crosstab, but you'll find "column & row" charts throughout the dashboards which translate very well. The “C&R” dashboard is a great place to start. With any Column & Row chart, you can exclude measures you don’t need from the view (and exclude them before downloading to CSV). To do this click, on the column header name of a measure you wish to keep in the view to highlight it blue, as shown below. Then, hold down the Control button to also select/highlight multiple columns at once. Lastly, hovering the mouse over one of the selected column headers, click "Keep Only" in the pop-up box, which will remove the measures you haven't selected from the view:

If you accidentally exclude columns that you meant to keep in the view, you can always use the "Undo" button in the upper left corner of your screen to bring all columns back into the view.
